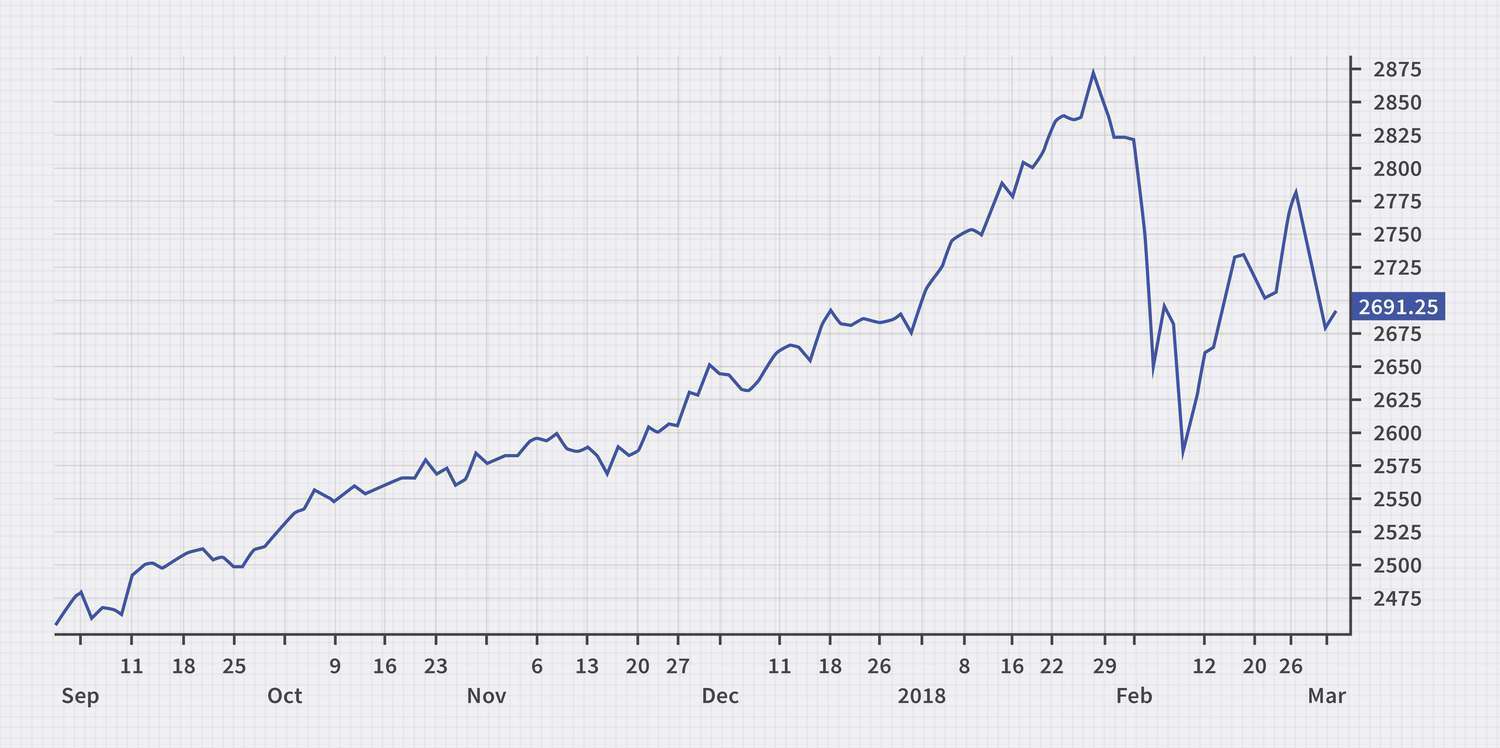
What is a Line Chart ?
A Line Chart is a type of graph that displays information as a series of data points connected by straight lines. It is commonly used to show trends over time.
Key Features:
- X-axis: Usually shows time (days, months, years, etc.)
- Y-axis: Shows the value (temperature, sales, etc.)
- Points connected: Each point represents a value at a specific time
Example Use Cases:
- Temperature changes during the day
- Stock price movements
- Website traffic over weeks
- Monthly sales growth
Line Chart Example using Chart.js:
<canvas id="myChart" width="400" height="200"></canvas>
<script src="https://cdn.jsdelivr.net/npm/chart.js"></script>
<script>
const ctx = document.getElementById('myChart').getContext('2d');
const myChart = new Chart(ctx, {
type: 'line',
data: {
labels: ['Jan', 'Feb', 'Mar', 'Apr', 'May'],
datasets: [{
label: 'Sales',
data: [150, 200, 180, 220, 300],
borderColor: 'blue',
fill: false,
tension: 0.3
}]
},
options: {
responsive: true,
scales: {
y: {
beginAtZero: true
}
}
}
});
</script>









Comments
Add new comment